Ben Simpson is a grazier and RCS coach based in Central Western Queensland. Together with his wife, Kim, Ben operates Thistlebank, a



Ben Simpson is a grazier and RCS coach based in Central Western Queensland. Together with his wife, Kim, Ben operates Thistlebank, a

Richard and his wife, Bernadette, run Stoneridge, a fourth-generation family grazing business near Young in South West NSW, where they raise sheep

David explains what unpaid labour really means and why it matters when calculating the true profitability of a business. He also explores the implications for cashflow, business continuity and succession when a business cannot afford the true cost of labour.
No plan survives first contact with reality—but successful businesses do. In this article, RCS Advisor David McLean explores why planning is only the first step, and how monitoring conditions and adapting decisions are essential for profitability. Discover practical insights to help you respond confidently to seasonal, market and operational challenges while keeping your business on track.
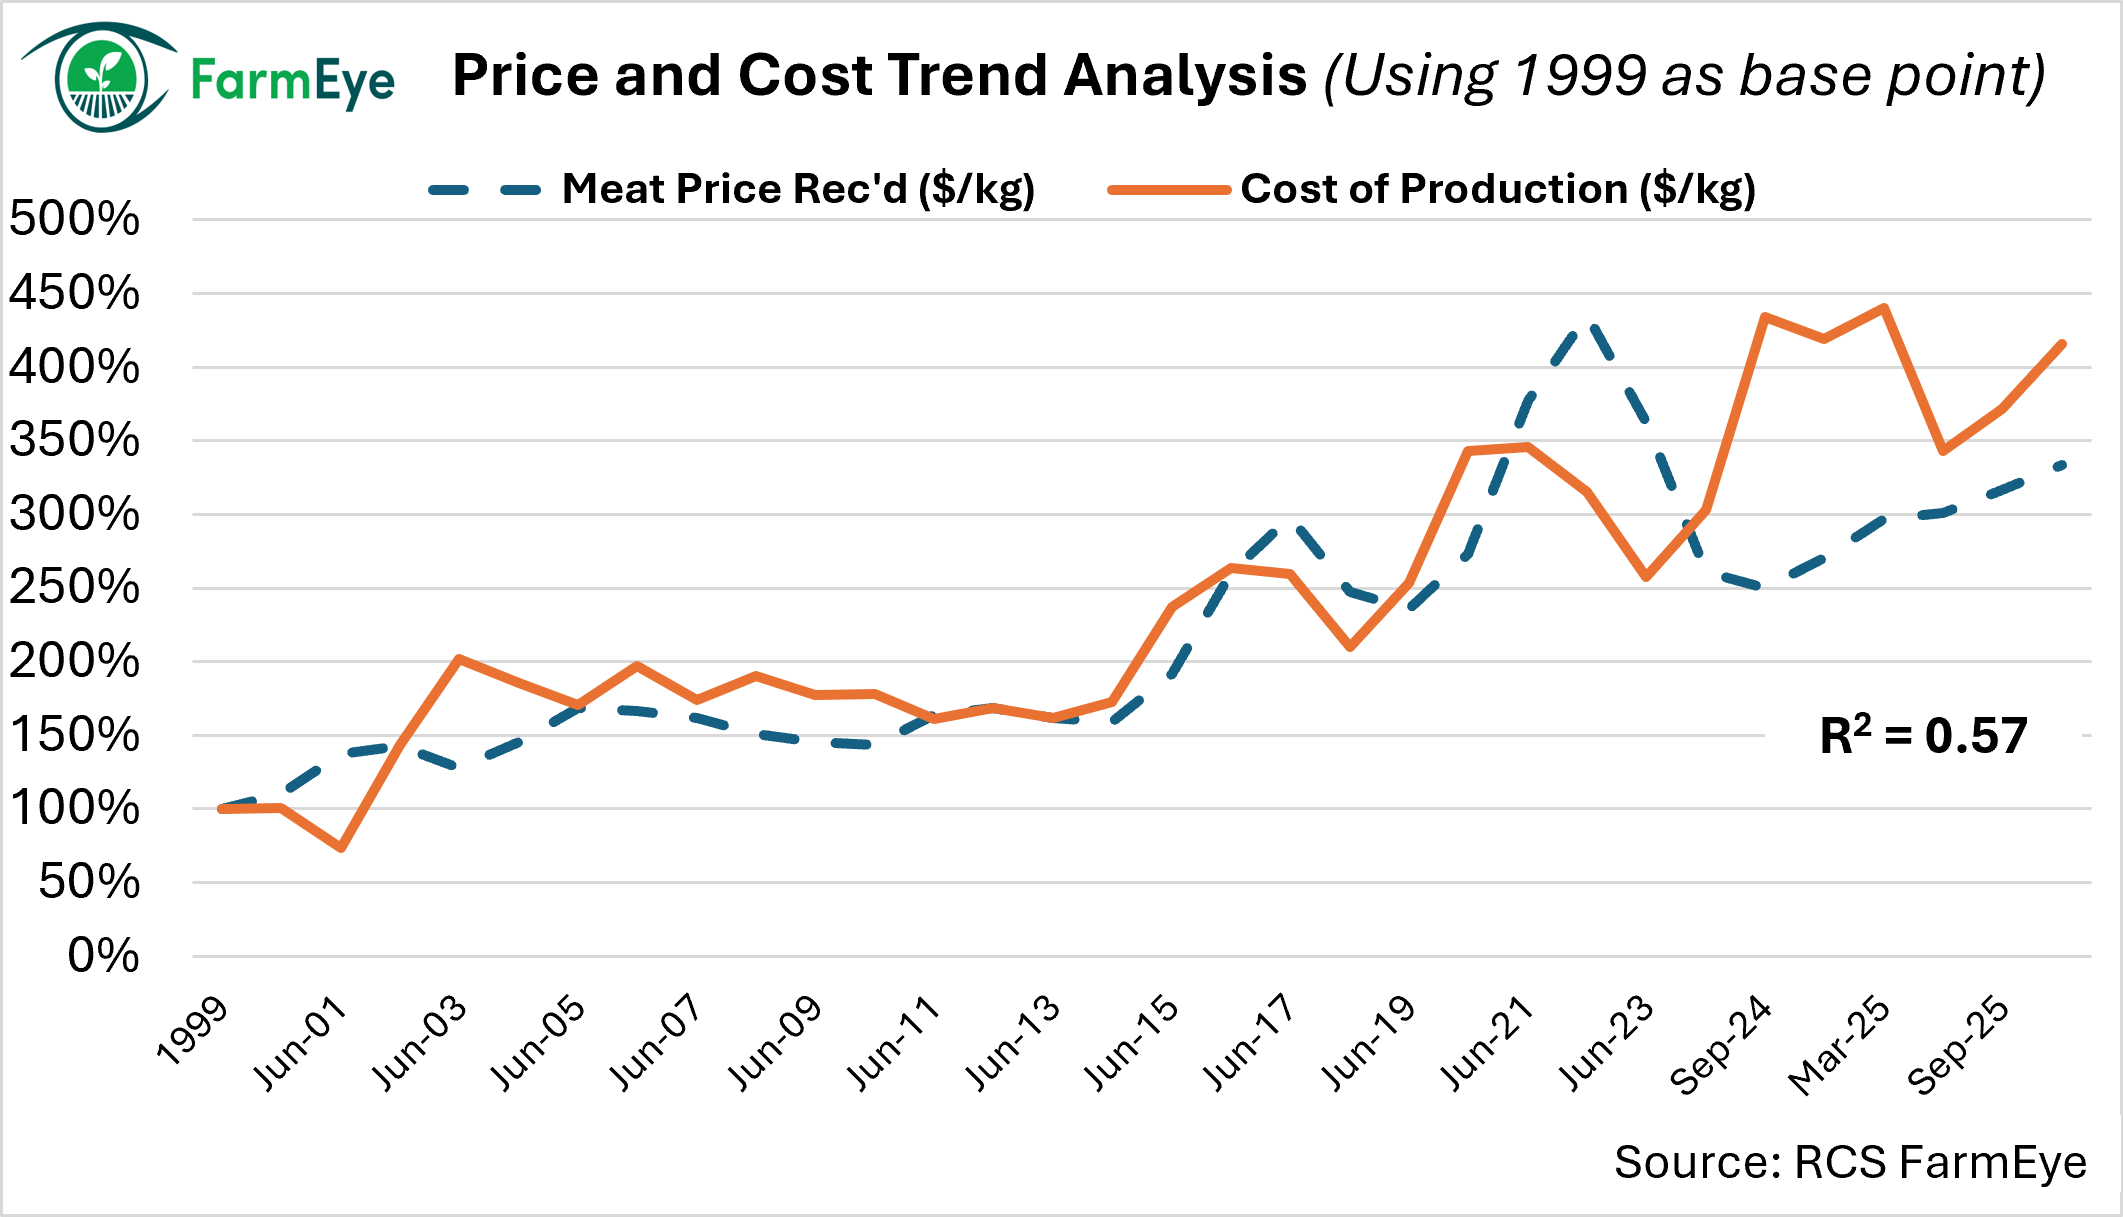
Profit doesn’t happen by accident—it comes from making deliberate decisions and regularly checking whether those decisions are delivering the results you want. In this article, RCS explores why quarterly profit planning meetings should be a priority for every farming and grazing business, and how using Cost of Production, benchmarking and focused business discussions can turn financial information into practical decisions that strengthen profitability and resilience.