Cost of Production shows a welcome drop

Probing into FarmEye Benchmarks

Cost of production shows a welcome drop

The well-known RCS Profit Probe benchmarking system now sits within a fully redeveloped platform called FarmEye®.  FarmEye® is a comprehensive, internet-based business analysis and benchmarking platform that offers significant advances in agribusiness management, accounting, and decision-making support.  One of these key benefits is to analyse your business on a rolling 12-month basis instead of being stuck in a financial year paradigm.  So, each quarter you can look back on the past 12 months and analyse your performance and trends.

Each newsletter, we’ll put one metric under the spotlight and Probe into it a little.

The metric this edition is the ever-powerful beef cost of production (COP) metric. It is possibly the best number you can look at to assess how resilient your business might be to the next cyclical downturn in markets, seasons or production. Another factor that makes it so valuable is that it doesn’t incorporate changes in market prices in its calculation, unlike when assessing gross product for trade/sale animals. With so much market variation, it’s challenging to monitor trends. Not for COP, though.

Cost of Production trends

Over the years, COP has increased in stages. In the 1990s, it was around $0.50/kg of beef. From 2002 to 2014, it stayed relatively static at approximately $0.84/kg for the Top 20%* performers (based on ROA) and $1.15/kg on average. In the following graph, you can see it has continued to ‘step’ up to our latest data for July 2024-June 2025, showing an average COP of $2.25/kg and Top 20%* of $1.82/kg. It is important to note that this only accounts for direct and overhead costs. Interest, tax, and capital items are all in addition to this.

The most encouraging shift I see in these figures is a decrease in the average COP, as shown by the blue bars. The 2024 calendar-average COP was $2.75, so we’ve seen a $0.50 drop. Will it remain there, or will it bounce back again?

What sets the Top 20% apart

Within your own business, I encourage you to review your COP, including interest costs. As shown in the graph, the businesses generating the Top 20% highest ROA (green bars) consistently manage a lower cost of production. It has a strong correlation to profit.

The best way to assess your economic resilience is to consider COP in relation to your average price received. The bigger the operating margin between price received and COP, the more resilient you are to variations. It could be variations in price received, seasonal conditions, or operating costs that will shift your COP.

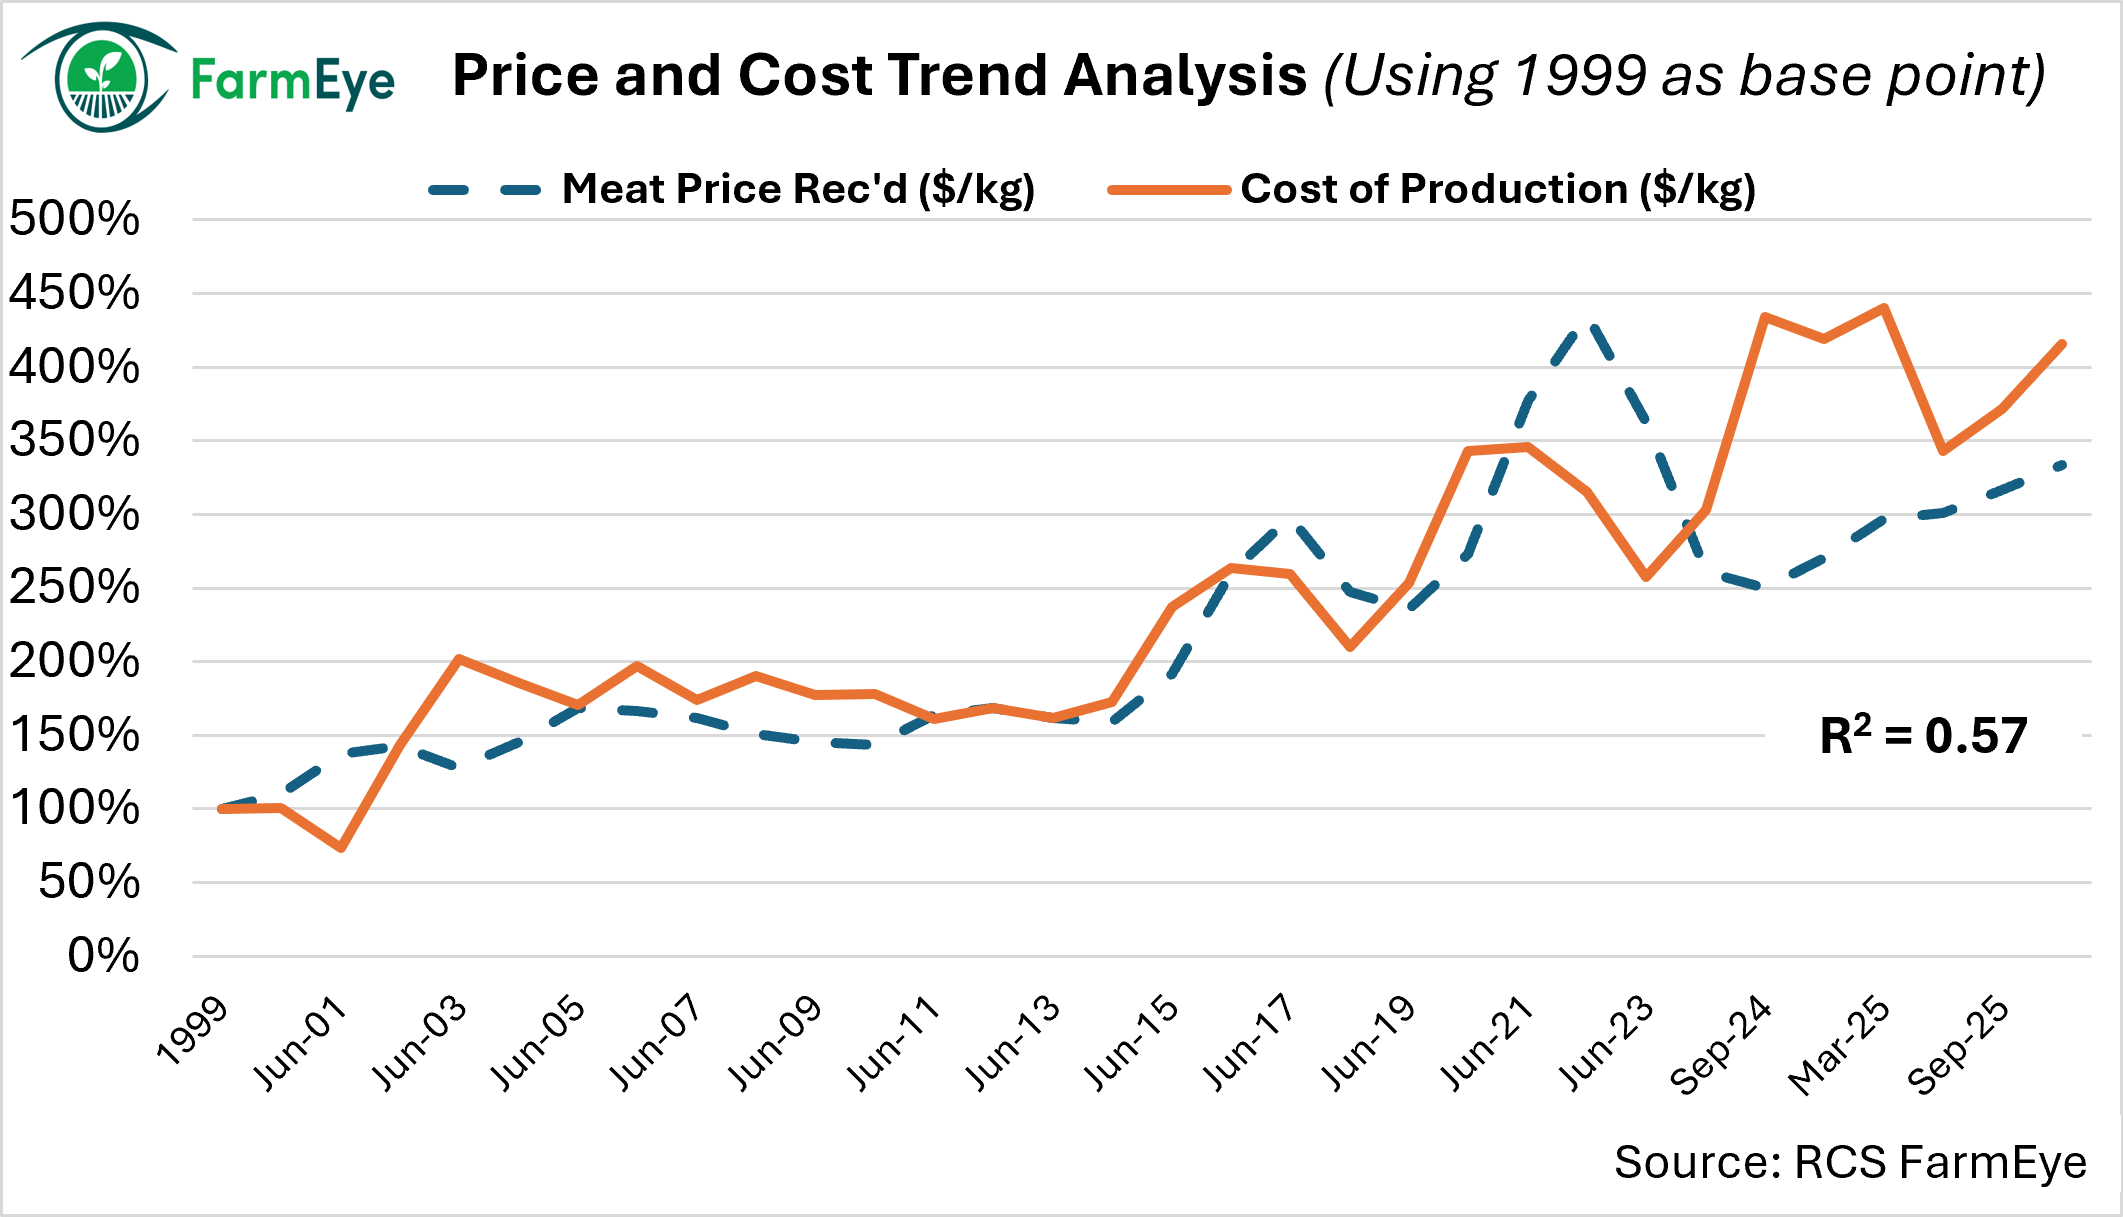
The following graph shows the price received (dotted line) and COP (solid line). The blue lines show the average for all businesses analysed, and the green lines show the results for the Top 20%.
The first point to note is that there is no significant difference between the price received for the Top 20% and the average result. In other words, the price received does not influence ROA. We’ve seen this decade after decade!

The second point to note is the gap between the Top 20% COP (solid green line) and the price received (dotted lines). Despite the variation in price received we’ve been seeing (and can’t control), the Top 20% have maintained a nice margin between the two, which equates to profit.

Even after the price dropped substantially from 2022 to 2024, the Top 20% maintained an operating margin of $0.84/kg for the year ending September 2024 (see the next graph). The same can’t be said for the average result, however. The average operating margin for the same period was minus $0.15/kg.

Focus on costs, not prices

As we talk about in Grazing for Profit® Schools, we need to focus on what we can control (COP) and not what we cannot control (price received). The result is consistent profits and a better night’s sleep!

* The quoted Top 20% metrics show us the characteristics of the most profitable businesses as measured by the highest Return on Assets (ROA).

FarmEye® is available for any business to use. It is a stand-alone product by RCS, developed specifically for agriculture with our clients.

RCS Logo

Join our mailing list